")
")
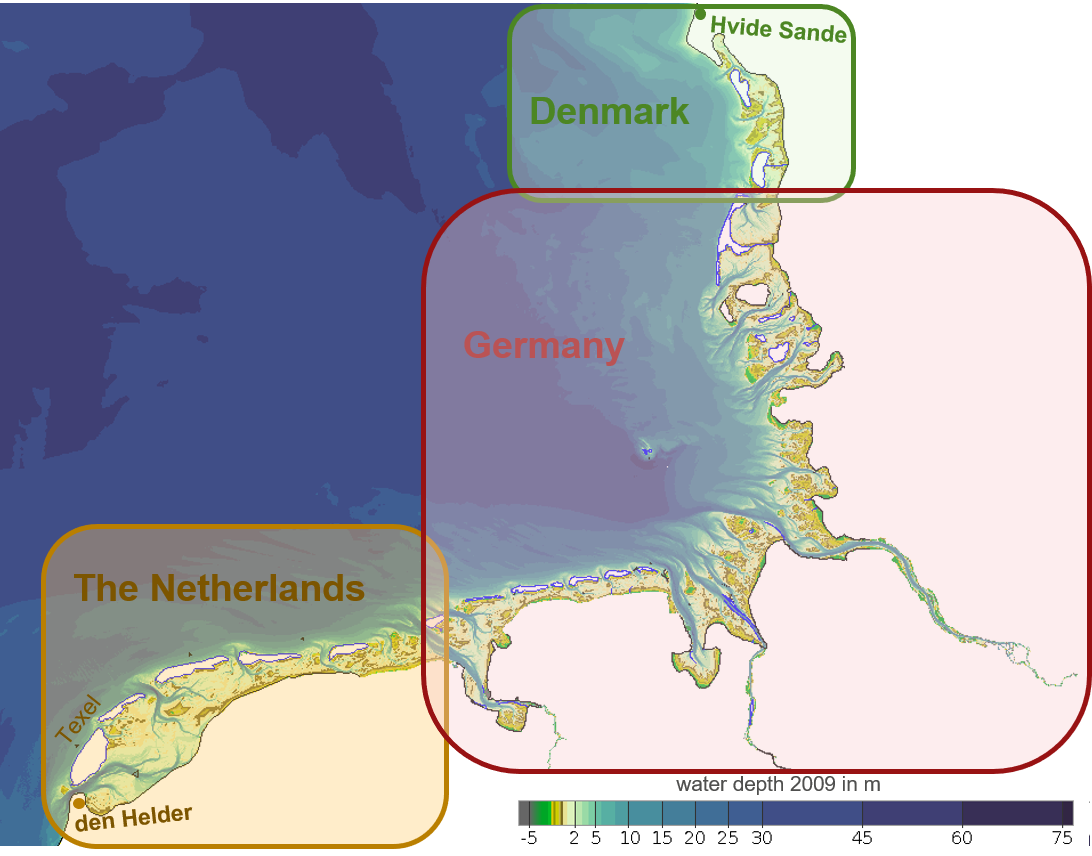
Digital hydro-morphological twin for the trilateral Wadden Sea area
The BMDV-mFUND project – TrilaWatt develops an innovative digital geodata and analysis infrastructure for the trilateral Wadden Sea area (Netherlands, Germany and Denmark).
This supports the planning and maintenance of transport infrastructure with harmonized, quality-assured data on geomorphology, sedimentology and hydrodynamics.
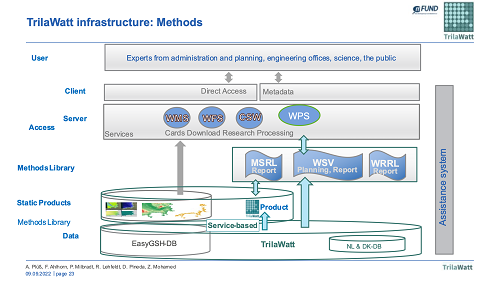
Geodata, analysis and documentation methods are linked via Web portals and services to form an assistance system.
About the Project
Challenges
The monitoring of the quality status of the Wadden Sea, and the planning and maintenance of transport infrastructure in the Wadden Sea Region are done along sectoral and country lines. This has led to fragmentation of measures and polices that have made cross-border collaboration in, for example data sharing and accessibility difficult. There are large amounts of data in the trilateral Wadden Sea region that are distributed across the region, difficult to access and are not homogenized.
Furthermore, there are various sectors with divergent interests and goals, who are competing for space in the maritime spatial planning of the Southern North Sea. These goals include the acceleration of renewable energy production, economic development, nature conservation, Shipping routes and ports accessibility, etc. Due to the lack of a trilateral geodatabase and analysis infrastructure, the planning of these goals and interests lack a holistic understanding of the Wadden Sea on a system level.
Thus, availability of quality assured and consistent database for the Wadden Sea is one of the major current challenges facing studying the Wadden Sea on system level. Reproducing the complex physical processes in the Wadden Sea area, especially in tidal mudflat regions such as large-scale sediment transport pathways, depend on availability of an accurate data situation, which is currently heterogeneous, patchy and not harmonized across borders.
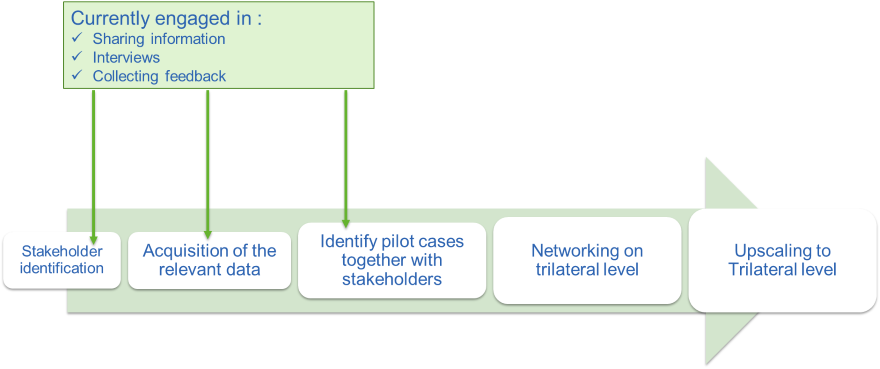 The WSF is cooperating with the German Federal Waterways Engineering and Research Institute (BAW, Lead partner) and two SMEʼs, i.e. smile Consult GmbH and planGIS GmbH, in order to compile these datasets and develop pilot cases. The project offer is to identify and take up selected cases based on stakeholder involvement on a trilateral level organized by the WSF. For example, these pilot cases could comprise investigations on topics such as accessibility of small Wadden Sea harbours, the development of the geomorphology in the Wadden Sea, which is linked to the OUVʼs, or the minimisation of disturbances of the World Heritage area potentially caused by maintenance work in fairways. Institutions and organisations throughout the WSR announced their support to the consortium such as Danish Coastal Authority (DCA, DK), LLUR (SH), NLWKN (Nds), Rijkswaterstaat (NL) and on the trilateral level the CWSS (with respect to TMAP), which guarantee data availability and the demand on cooperation for jointly working on these topics in the entire Wadden Sea area. Shortly, the WSF’s task in this project is to
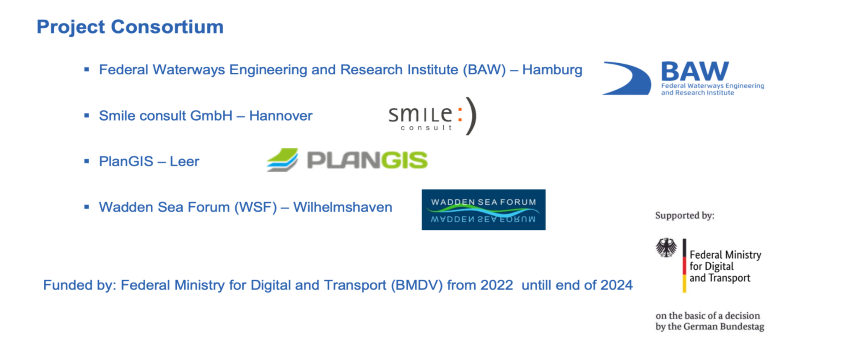
Visualization
for detailed information please click on images to enlarge


The GIF provided above containing the depth elevation (bathymetry), mean grain size (sedimentology) and a GIF showing both bathymetry and sedimentology simultaneously, respectively.
Each image shows data simulated for each year selected for this simulation animation. Some images may not belong specifically to the year that they represent for visualization purposes only.
The main purpose of showing these short animations is to show the viewer how the seabed changes its elevation distribution and with it, the soil composition, from year to year and how the sedimentation and erosion process are active in such dynamic areas, helping us to understand the importance of obtaining detailed information even in the smallest scales to improve the results of the different intended studies.
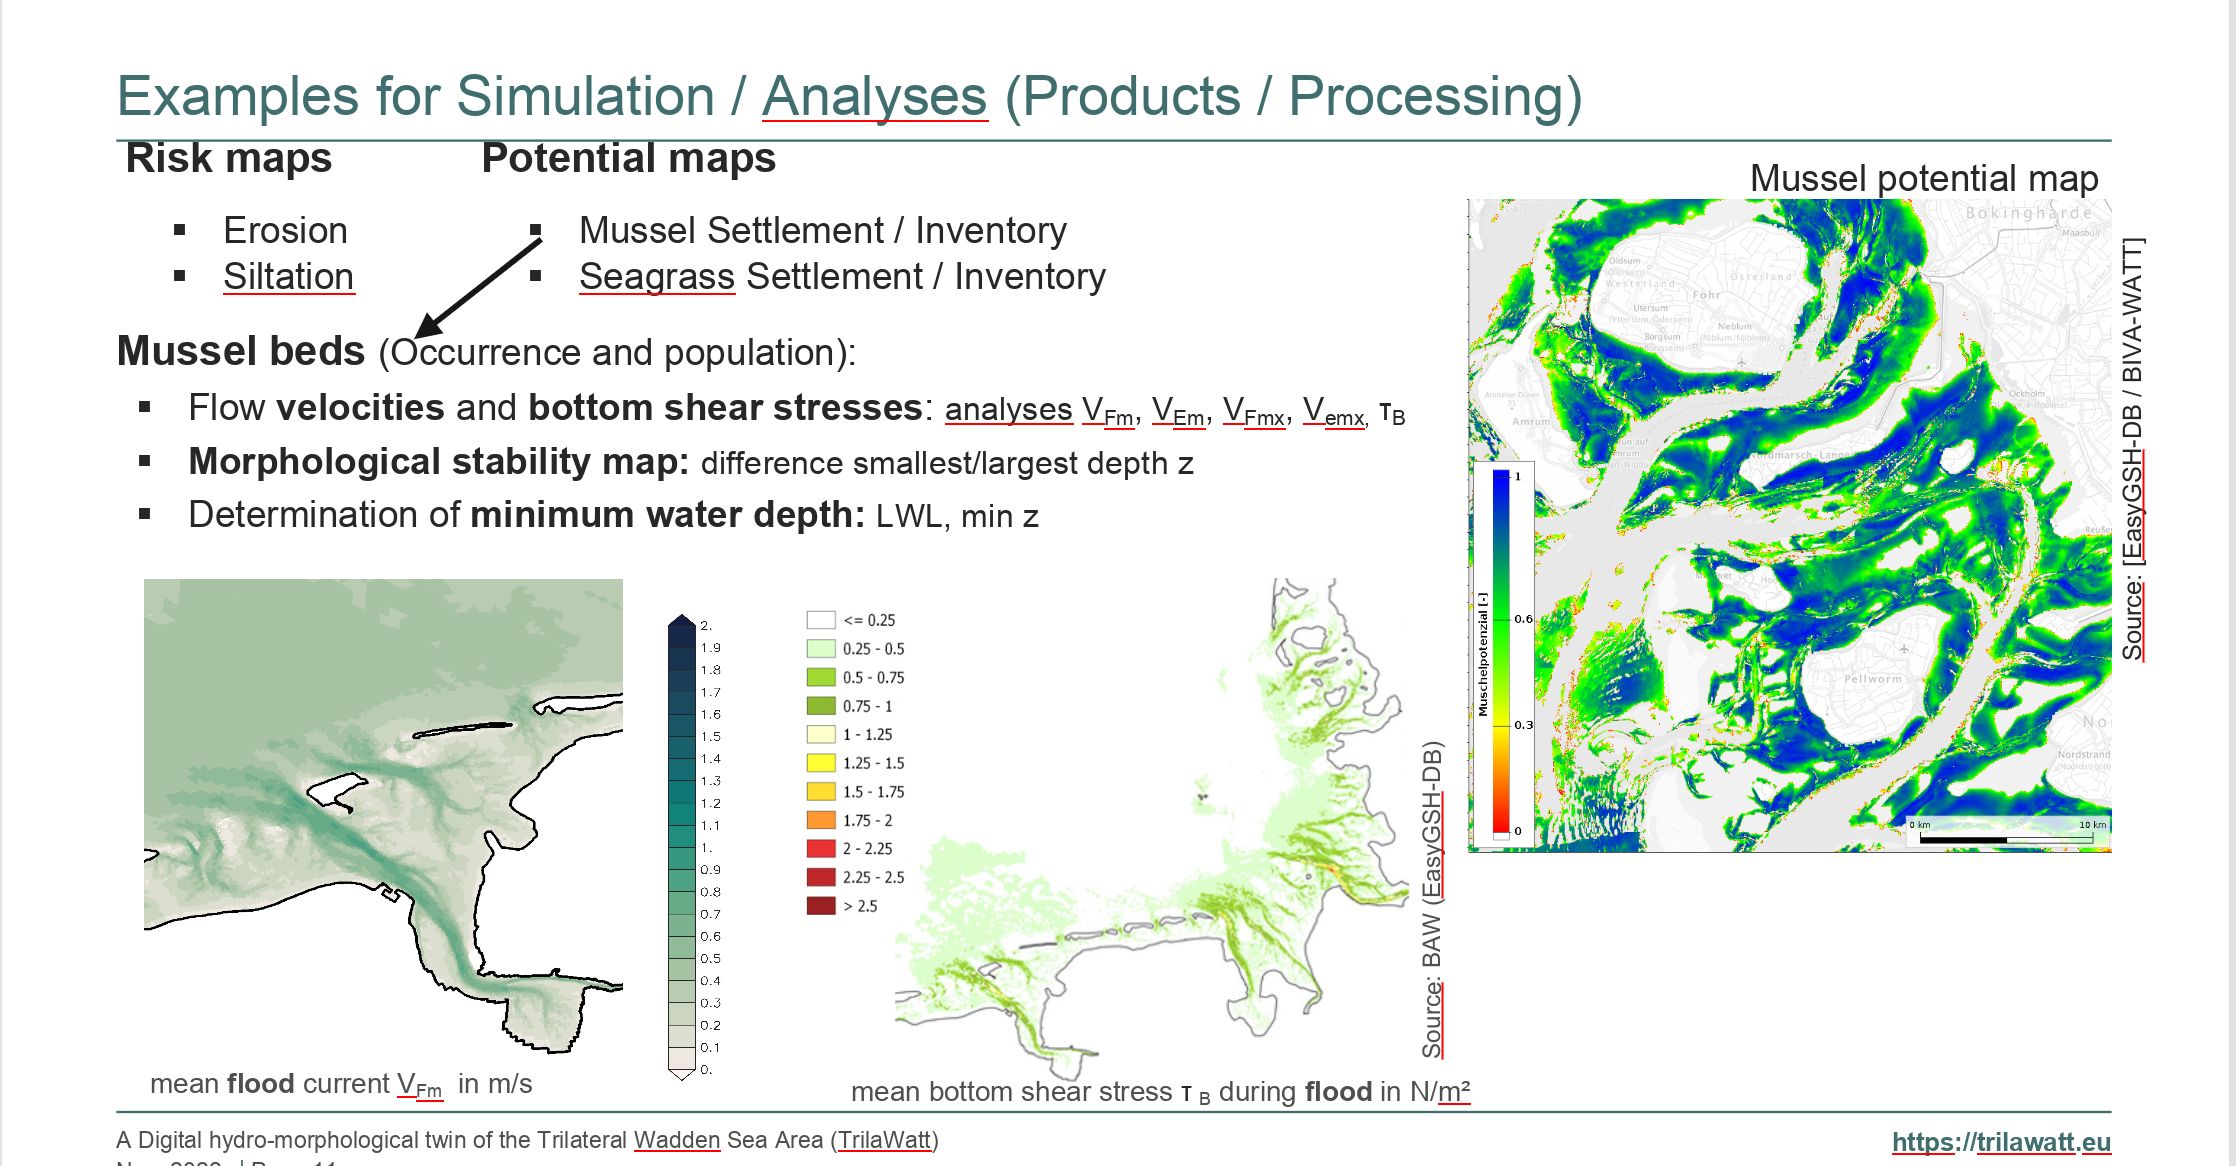
Tidal characteristic values (e.g., tidal range) are required in the entire trilateral Wadden Sea for marine spatial planning, coastal and offshore construction, ecological tasks, etc. We can support these tasks with numerical simulation results from the entire trilateral Wadden Sea area. Exemplary results, as shown, are:
- Tidal range
- Peak sea surface elevation
- Mean, peak, and residual flood
- ebb current velocity
- bed shear stress
Tidal characteristics will be computed in the years 2005, 2010, 2015, and 2020 and will be available in common gridded download formats.
Increasingly higher resolutions and good data availability require efficient support for navigation and handling (e.g. difference formation or clipping). This is especially true for complex process chains. In TrilaWatt, this process is to be supported by an interactive, web-based assistance system that can be used to generate any number of user-defined data products
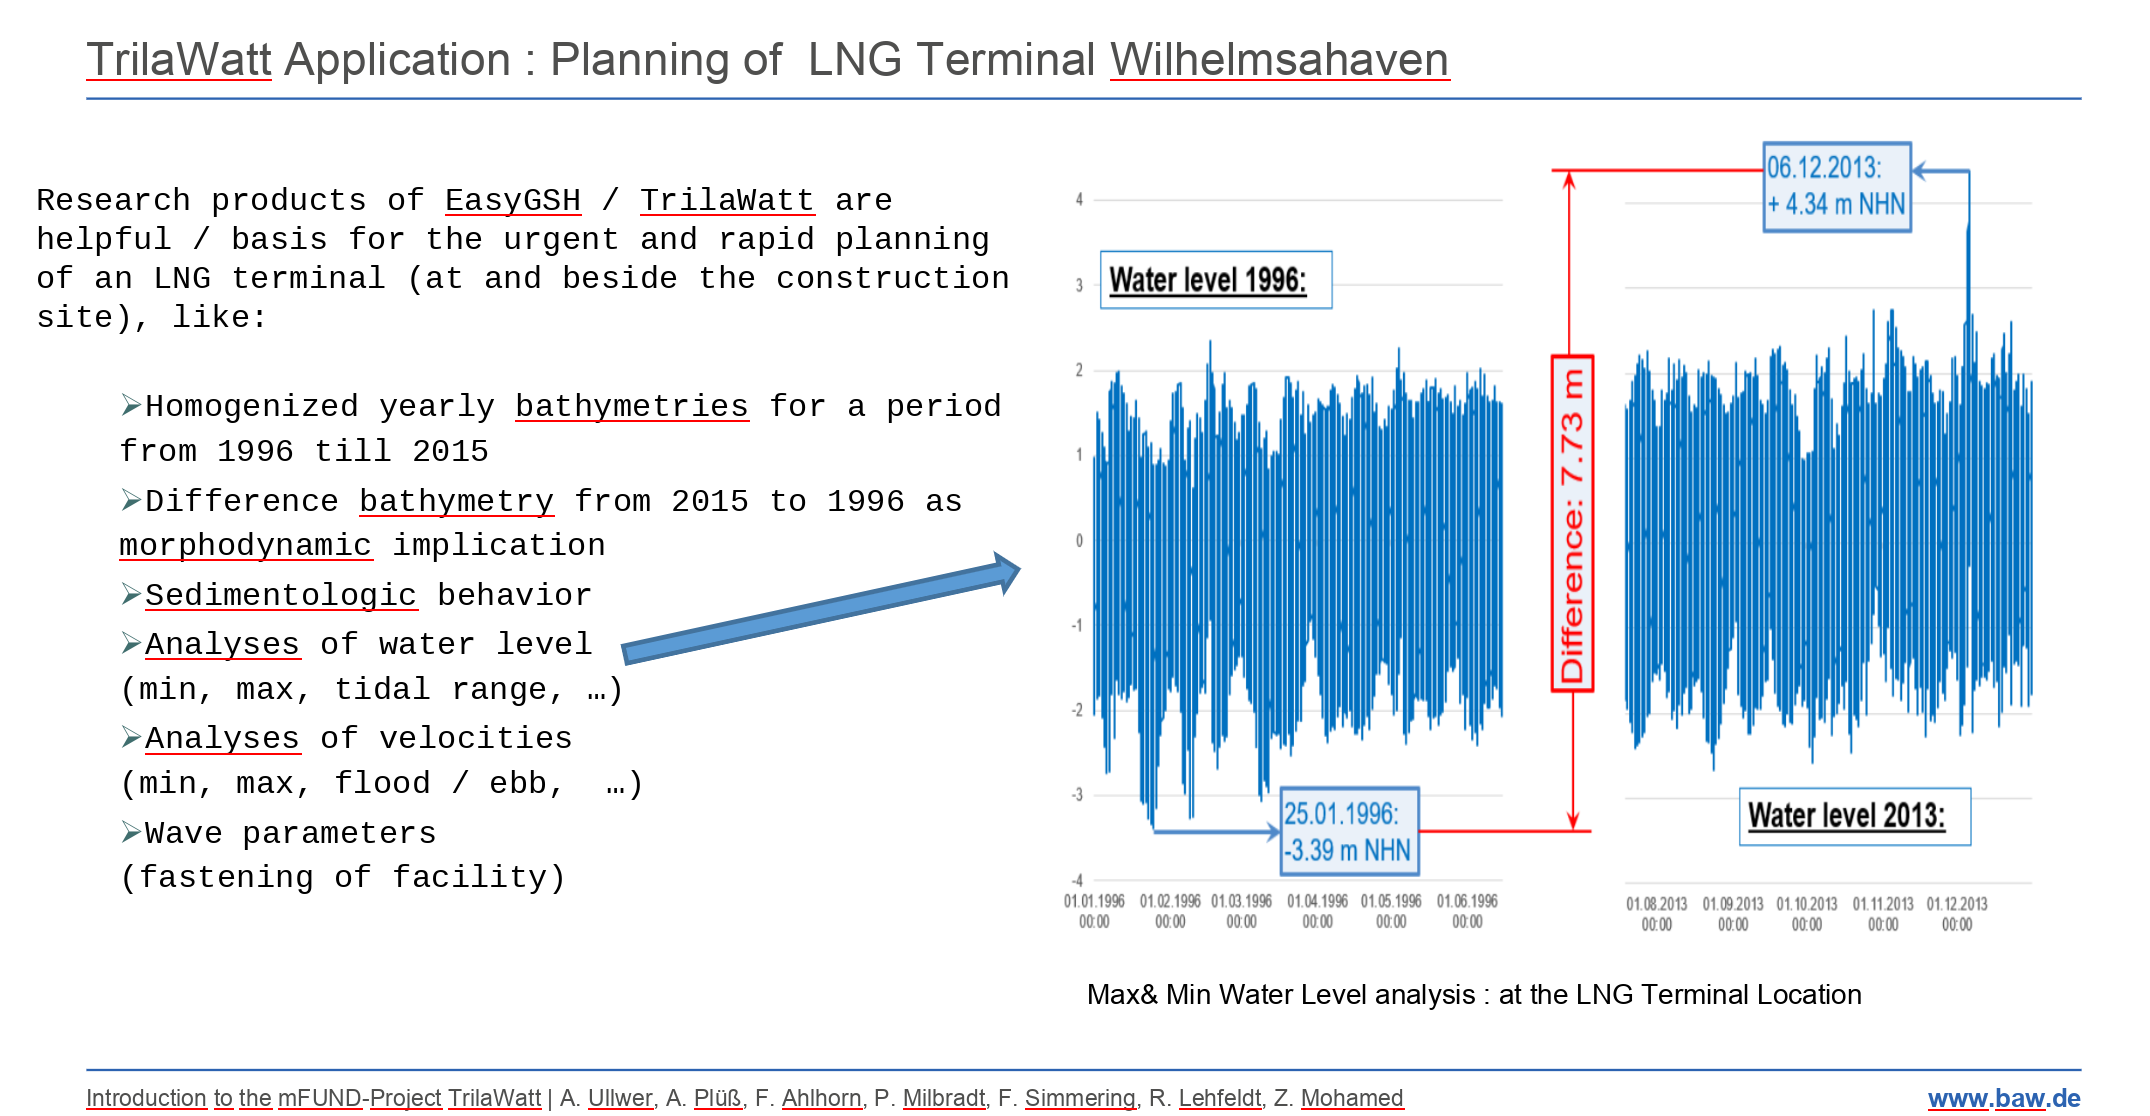
The urgent need for constructing a terminal for Liquefied Natural Gas (LNG) is obvious for reducing / stopping the gas import from Russia to Germany. This includes fundamental data and analyses about water level and velocities direct at and in the surrounding of the construction site.
- In a first step the commissioned consultant ARCADIS used the present data from the web-site of EasyGSH-DB https://mdi-de.baw.de/easygsh/EasyEN_index.html#home.
- For detailed information in the surrounding of the planned construction time series of water level and velocities are extracted out of the EasyGSH-data set by BAW.
- The compilation of the used products is carried out with a GIS system. The planned assistance system of TrilaWatt could be used online and will be more practical for these appli-cations.
- The following analyses are scheduled: Analyses of velocities and water levels are important for the construction level.
Together this gives a feasible location option for the possible / optimal position of a terminal.
In summary, this application shows that the EasyGSH and TrilaWatt data products and analyses provide useful insights into the behavior of the Trilateral Wadden Sea. In particular, the consistent quality assured, and long-term data form a good basis for a wide variety of usage!
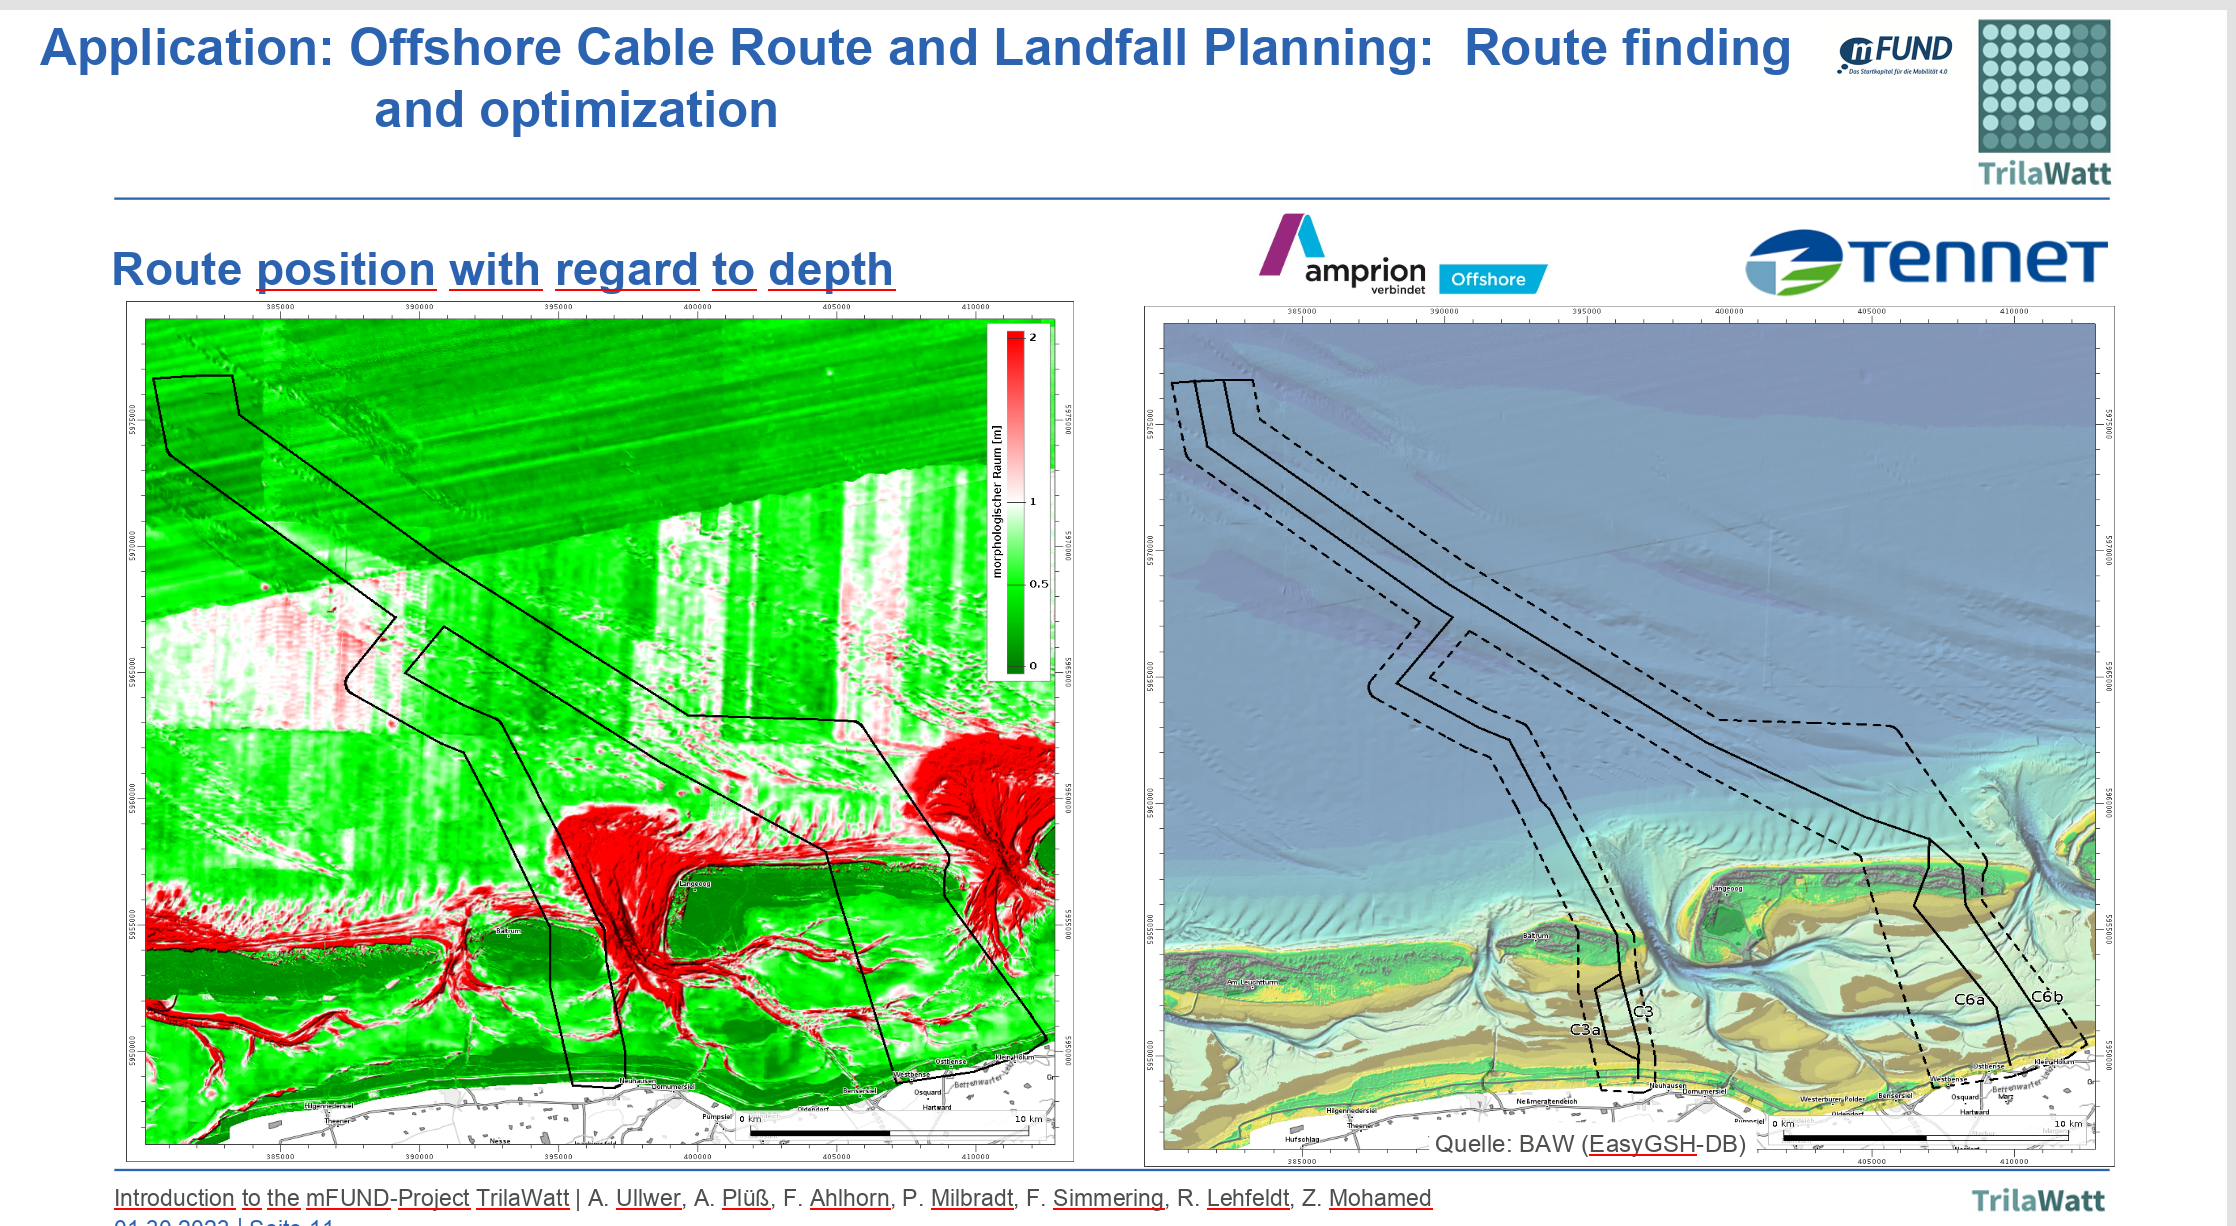
Route planning and optimization of cable routes from Off-Shore-Wind-Energy-Parks to the mainland are of major interest for the Offshore Wind Energy-Industry. Planning of new and optimization of actual routes and burial depth must require different objectives concerning morphological stability, location outside of fairways, sedimentological and hydrodynamic circumstances, … - for longer time span. The compilation of the used products is carried out with a GIS system. The planned assistance system of TrilaWatt could be used online for that purpose convenient.
Herein this example the realized analysis are:
- Selecting the lowest and highest bathymetry elevations (for a chosen time period) as ameasure for the morphologic activity as a planar map
- Combining the morphologic activity map with the sediment information for a technical realization (burying depth)
- Analyses of velocities and water levels are important for the construction level
All this gives a feasible location option for the possible optimal cable routes. Moreover, these products and analyses are expedient for the recently planned hydrogen pipeline between Norway (Equinor) and Germany (RWE)!
In summary, this application shows that the TrilaWatt data products and analyses provide useful insights into the behavior of the Trilateral Wadden Sea. In particular, the con-sistent quality assured, and long-term data form a good basis for a wide variety of usage!
in preparation - more information will follow soon ...
slideshow plays automatically, but images will pause on mouse over